Homework 2 Math 241/242 Fall 2008
Construct an EXCEL worksheet that will function as your graphing calculator for the rest of the semester. Try to make it as pleasant to use as possible. Include sufficient directions (right on the worksheet) so that you will be able to use this sheet with little or no difficulty after months of not having used it. The inputs should be the starting and ending value of the independent variable (x) and the rule defining the function defined in a VBA module attached to the file.
You should create cells labeled “First x” and “Last x” that the user (you) can modify to look at different intervals. You should include directions for accessing the VBA editor file defining f. Make columns of 50 x values with Dx=(Last x – First x)/49 and 50 corresponding y values. Add a graph of the 50 (x,y) pairs.
Use your workbook to graph
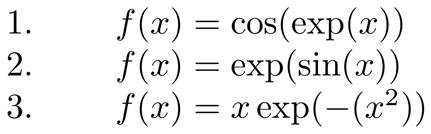
Take screenshots* of the graphs (choose suitable intervals) and insert the images into your spreadsheet on a separate worksheet from your graphing calculator but in the same workbook.
* http://www.iopus.com/guides/screenshot.htm